Health, activity & tasks
Bitsmith gives you three views into what your server is doing: a health summary, an activity log of what changed, and a tasks view for work in progress.
Health summary
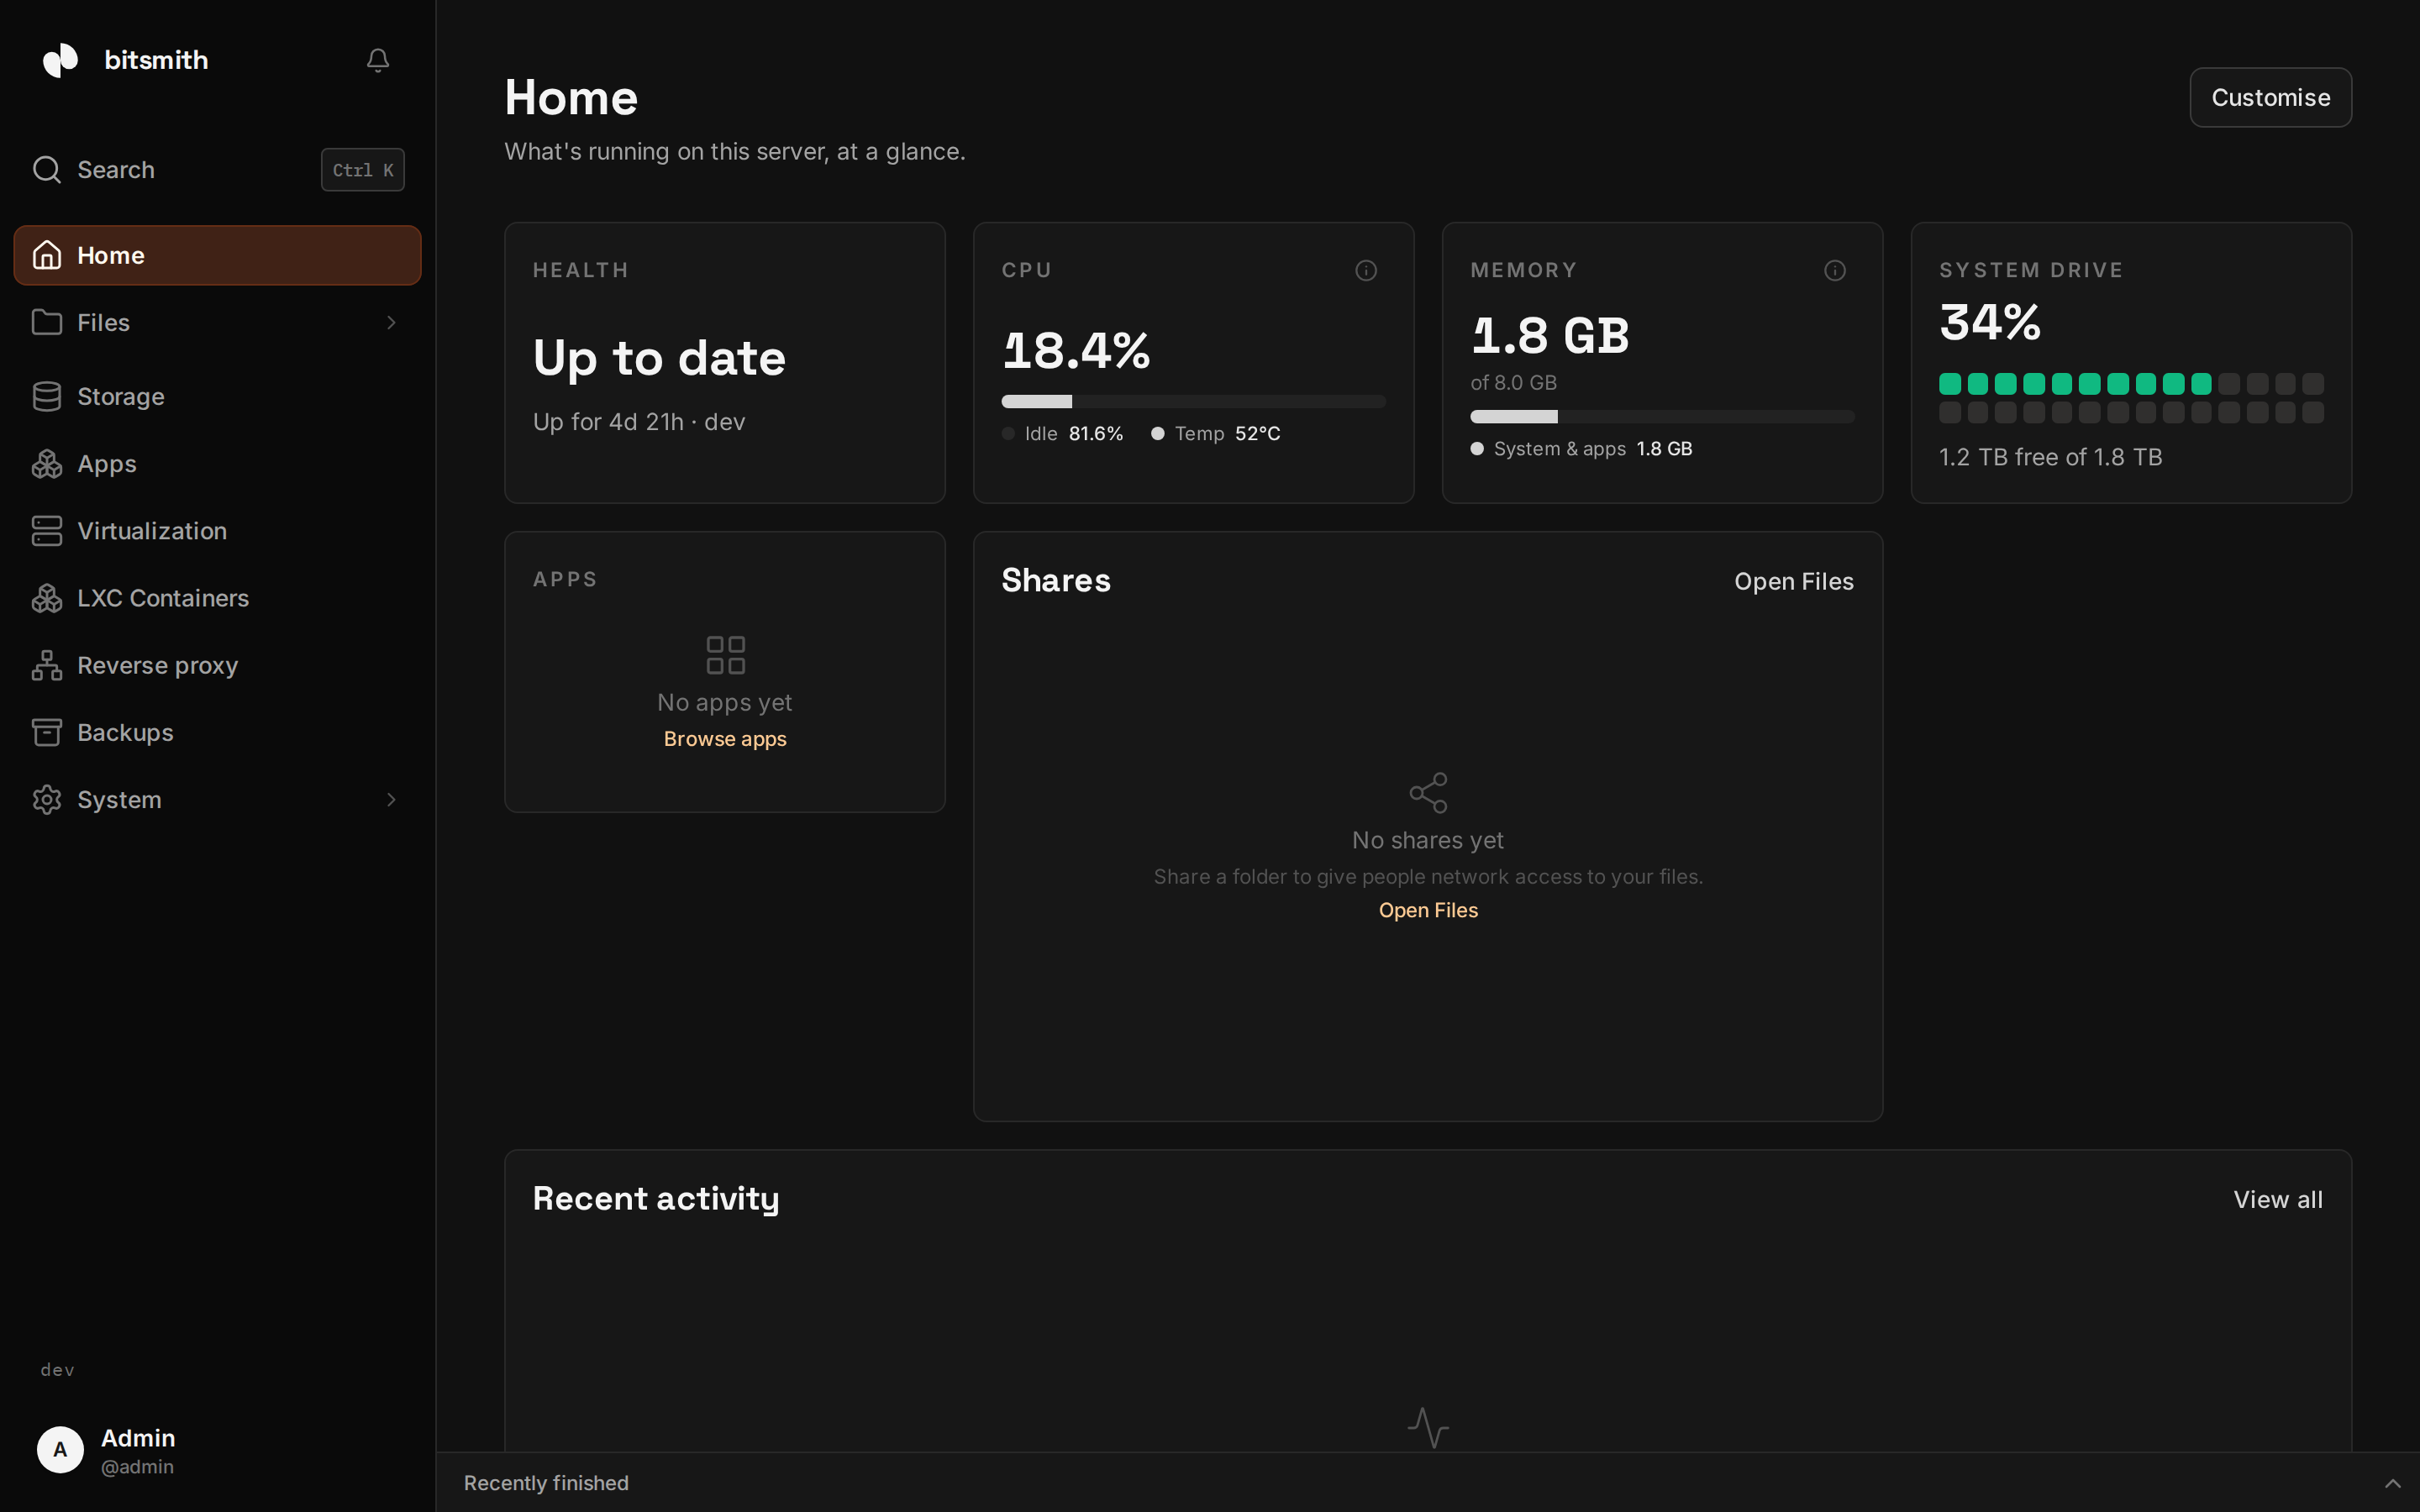
Section titled “Health summary”The Home page is a widget board you build yourself: add, resize, or remove widgets for CPU, memory, storage, shares, apps, virtual machines, containers, backups, tasks, and recent activity, with whichever you want on screen. A GPU widget is listed as coming soon. The default board shows your server’s vitals, storage usage, and whether an update is available. Storage spaces show their status here too, so a degraded space is visible the moment you open the interface. An alert bell in the header counts the alerts that need attention.
Activity log
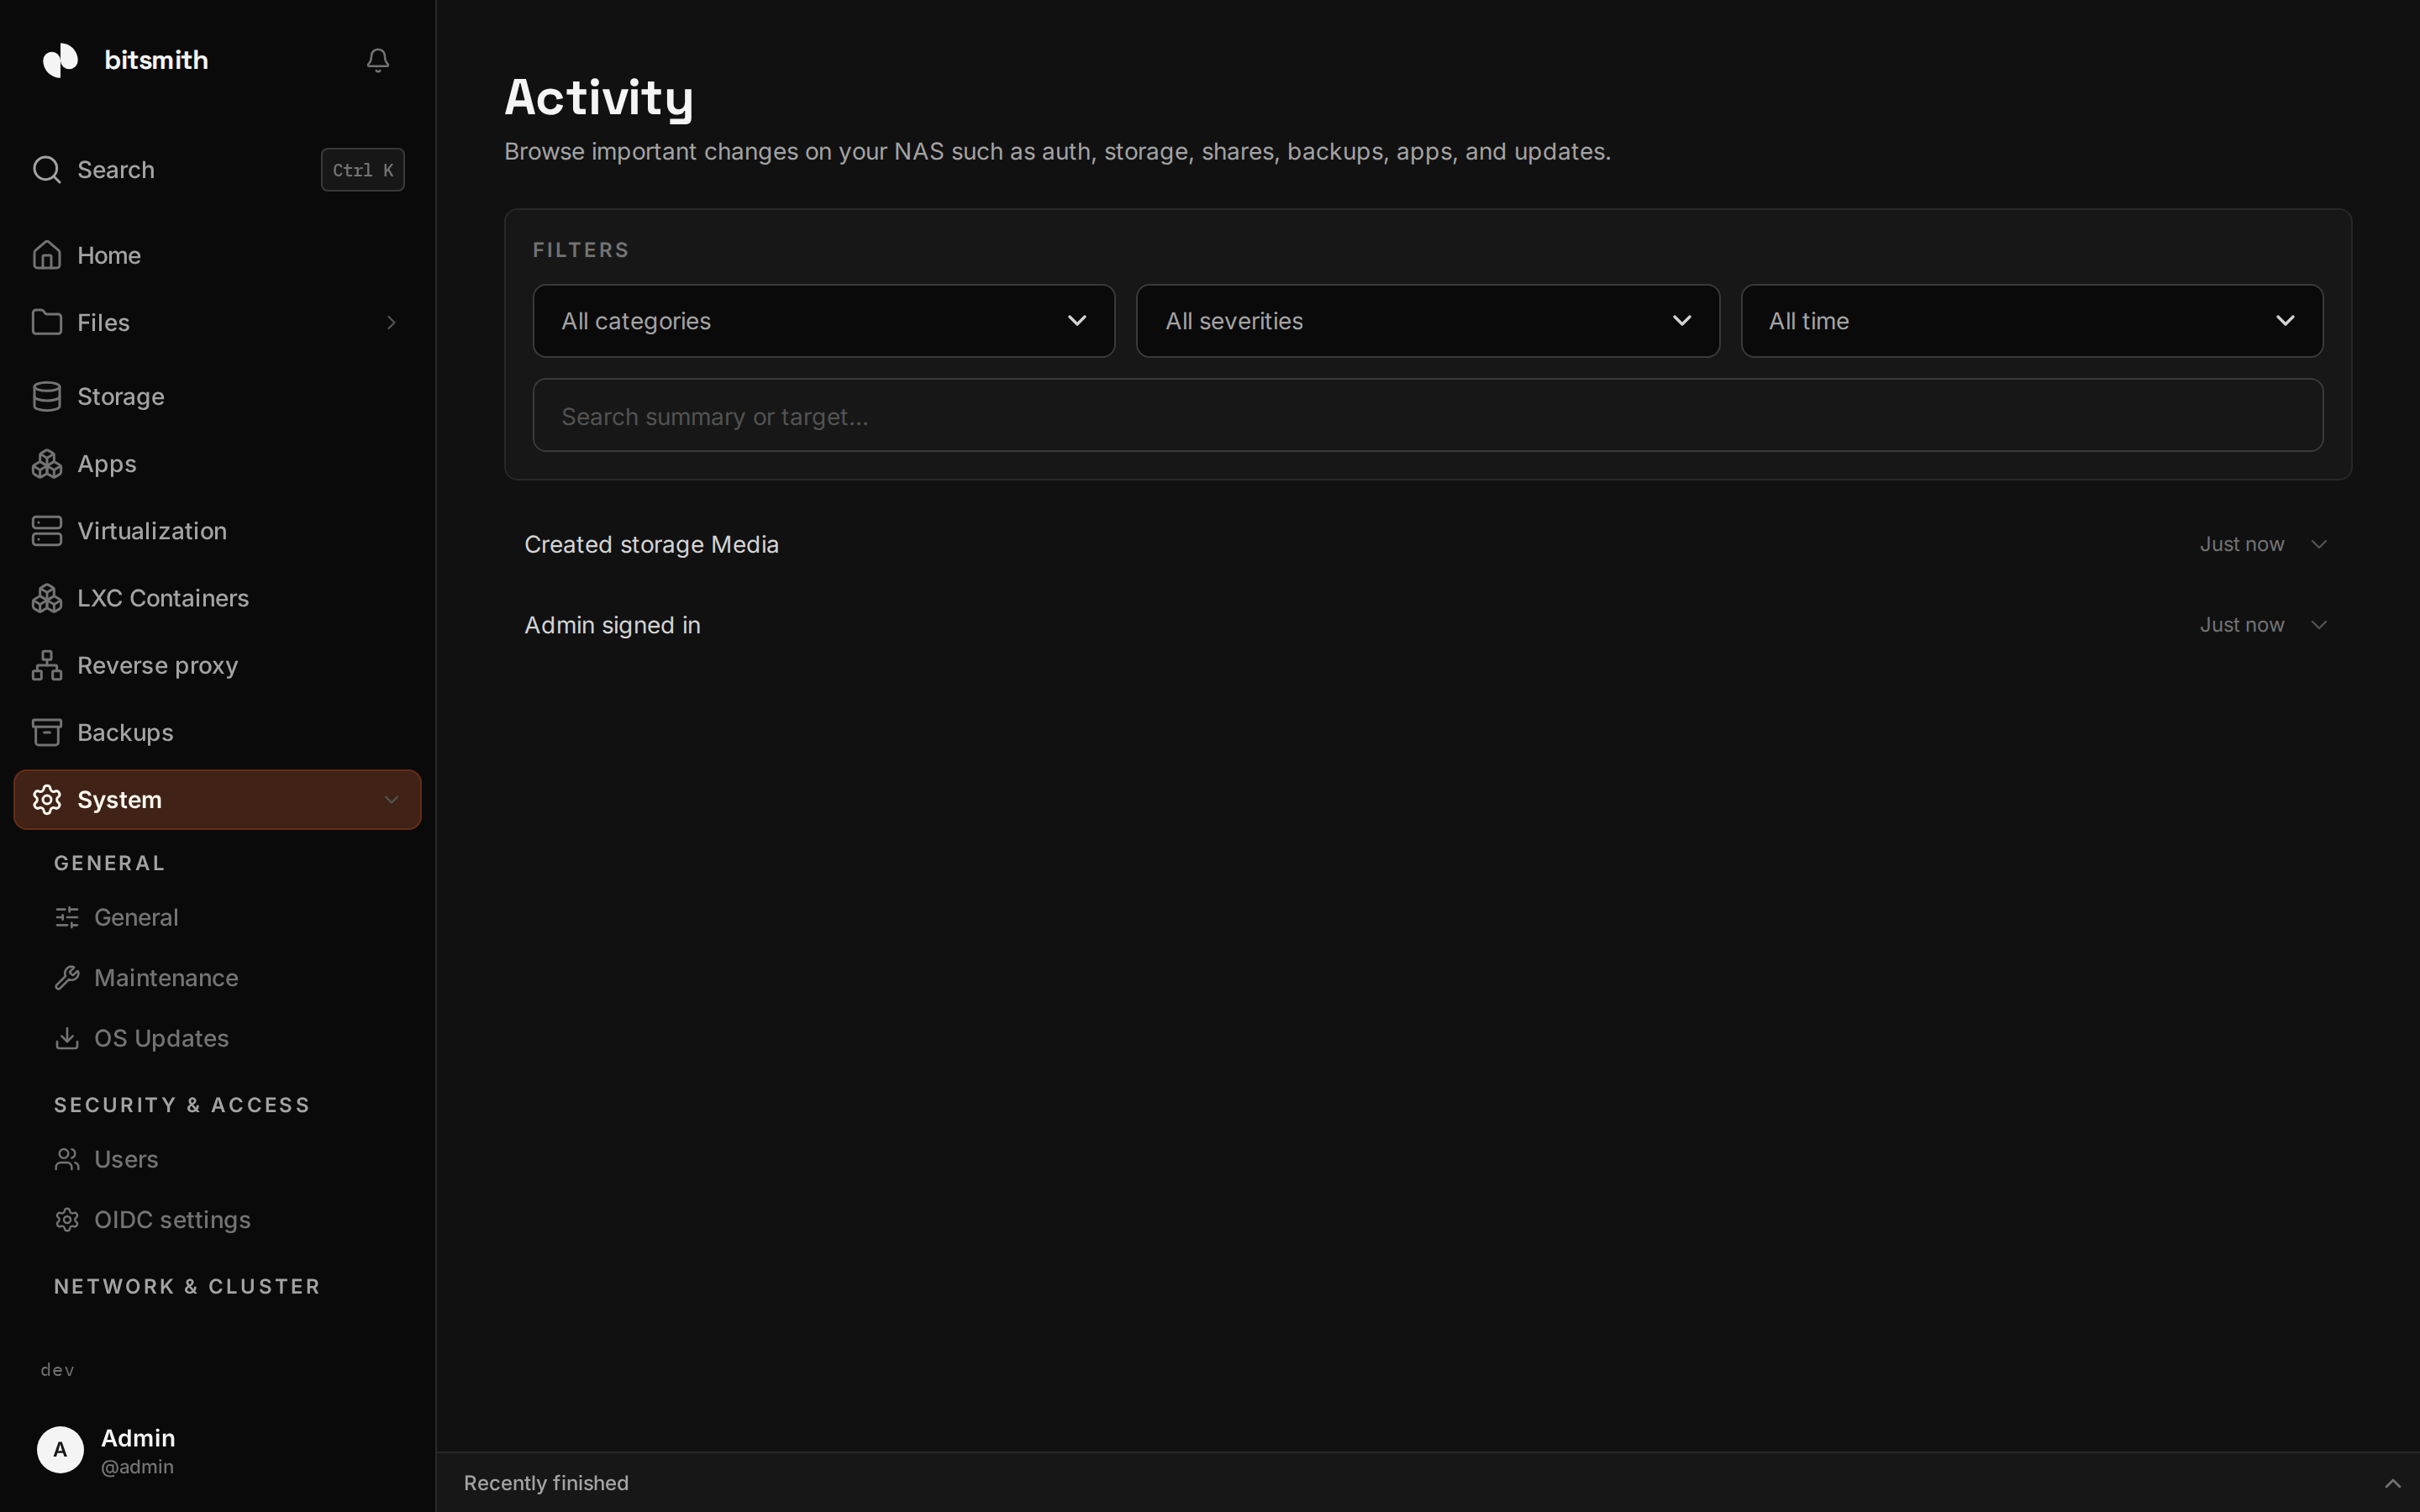
Section titled “Activity log”Activity (under System, Diagnostics) is the record of important changes: sign-ins, storage created, shares changed, apps installed, backups run, updates applied, and actions taken by AI agents. Filter by category, severity (info, warning, critical), result or time range to find what you’re after, or search for words in an event, the thing it is about or who did it, in the language you read the page in. Events that failed, such as a backup run or a sign-in, are marked Failed, and the Failed result filter shows only those. New events appear at the top as they happen. Home’s Recent activity shows the latest events from every server, leaving out sign-ins and sign-outs, and marks the failed ones the same way.
Each server keeps its activity for 90 days. Older events are deleted every hour, which is why the longest time range is Last 90 days.
This is the first place to look when you want to know what happened and when, for example after an agent ran overnight or when something changed unexpectedly.
Long-running work (creating storage, importing a VM image, running a backup) runs in the background as a task. Tasks shows what’s in progress with progress bars and estimated time, lets you cancel work that supports it, and keeps a history with per-task logs so you can see how a job went.
Where the logs live
Section titled “Where the logs live”There’s no separate system log page. Per-task logs sit with each task on the Tasks page. Each virtual machine keeps its own VM logs under its details. For a bigger picture, the Support page bundles VM logs, recent task output, activity, storage, and health into one diagnostic file you can download.